Plot VLBI images
This is a python package to plot VLBI images. It can plot the images from Difmap, AIPS, and FITS files.
Usage
Here list the usage of the package.
$  python shao_plot_VLBI_images.py -h

usage: shao_plot_VLBI_images.py [-h] [--redshift REDSHIFT] [--rms RMS] [--pixels PIXELS] [--parsecs PARSECS] [--sigma SIGMA] filename

Plot VLBI images based on the given parameters

positional arguments:
  filename              Name of the FITS file

options:
  -h, --help            show this help message and exit
  --redshift REDSHIFT, -z REDSHIFT
                        Redshift
  --rms RMS, -r RMS     RMS of the image
  --pixels PIXELS, -k PIXELS
                        Number of pixels in each axis
  --parsecs PARSECS, -p PARSECS
                        Size of the parsec
  --sigma SIGMA, -s SIGMA
                        Sigma of the contour
First change to the directory of the FITS file, then run the following command, it will generate the plot of the image in output directory.
For single fits file, type the following command:
$ cd /the/path/of/fits/file
# the generate image will save into output
# usage:
# shao_plot_VLBI_images.py [-h] [--redshift REDSHIFT] [--rms RMS] [--pixels PIXELS] [--parsecs PARSECS] [--sigma SIGMA] filename
# For example
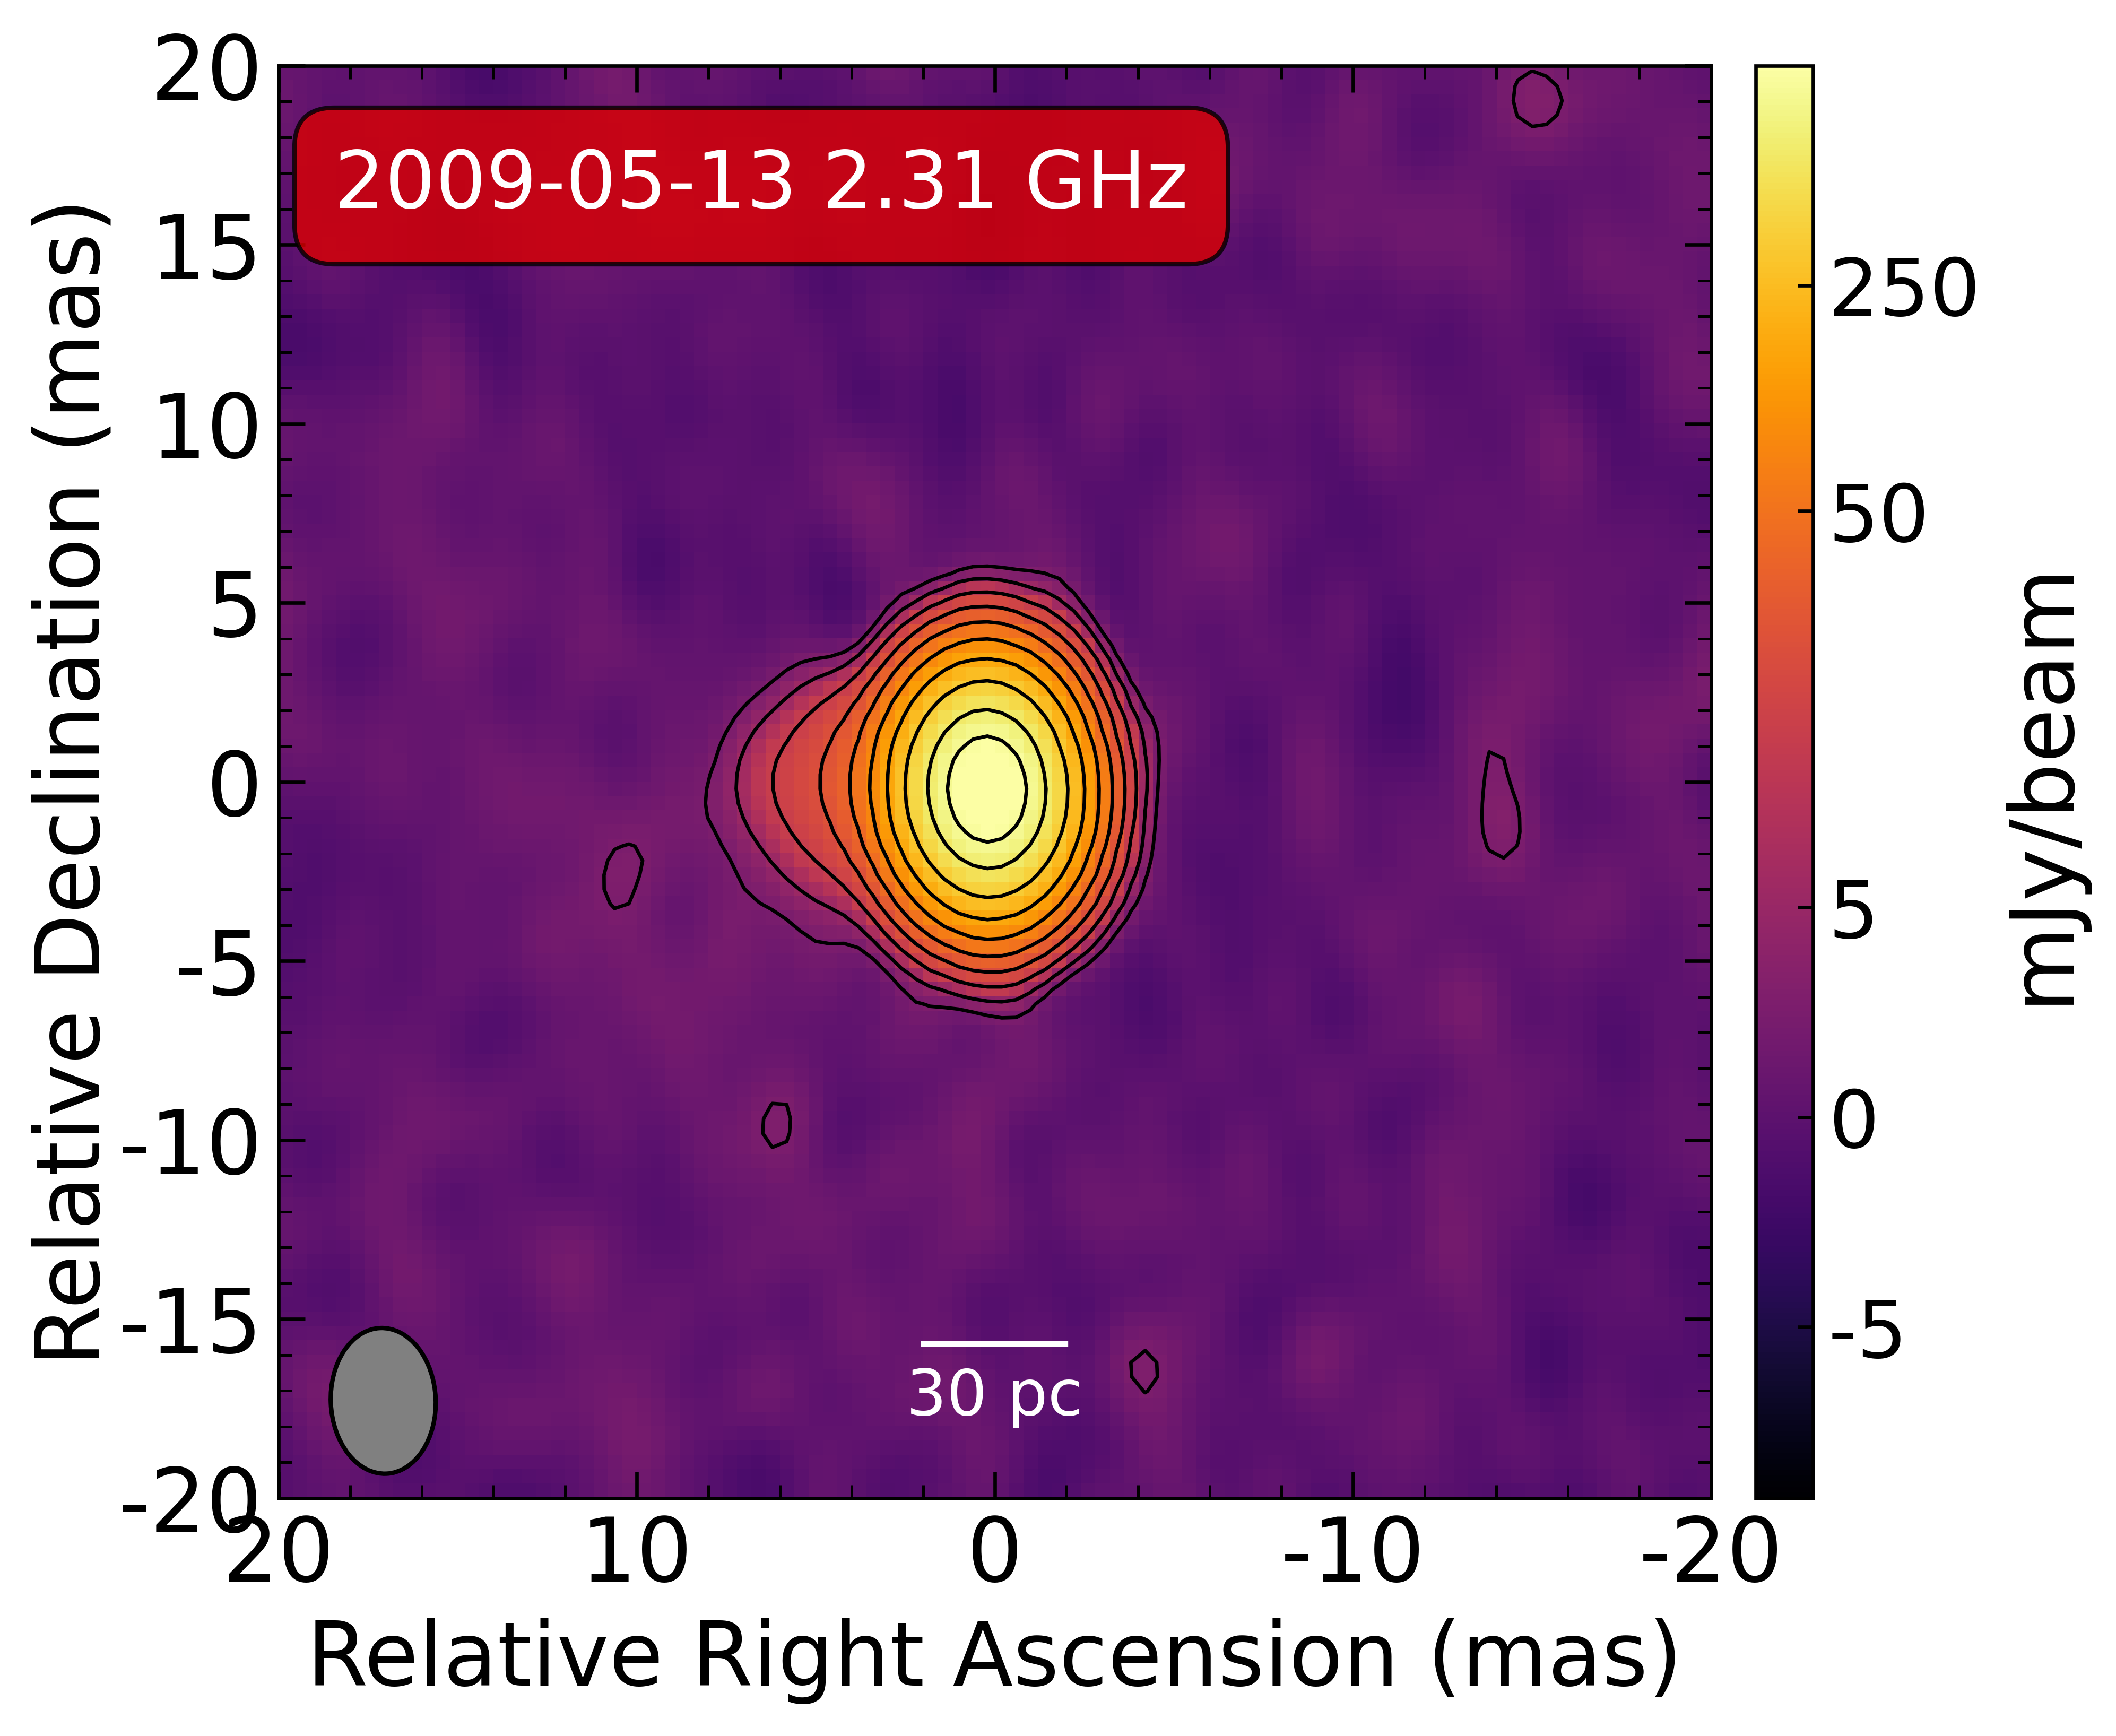
$ python3 shao_plot_VLBI_images.py J0646-20090513S-cln.fits --redshift 3.396 --rms 1.5 --pixels 20 --parsecs 30 --sigma 3
The output image looks like the following image.
Note
In general, we will using k = 40 for L band, k = 20 for S band, k = 5 for U and X band. You can change the value of k according to the image quality.
The following is the example of the usage of the package, which was published in the paper of “The first VLBI image of a supernova remnant in M82”.
$ python3 shao_plot_VLBI_images.py J0646+20100521S-cln.fits --redshift 3.396 --rms 1.5 --pixels 20 --parsecs 30 --sigma 3
$ python3 shao_plot_VLBI_images.py J0646-20090513X-cln.fits --redshift 3.396 --rms 1.5 --pixels 5 --parsecs 10 --sigma 3
$ python3 shao_plot_VLBI_images.py J0646-20090513U-cln.fits --redshift 3.396 --rms 1.5 --pixels 5 --parsecs 10 --sigma 3
$ python3 shao_plot_VLBI_images.py J0646-20100528U-cln.fits --redshift 3.396 --rms 1.5 --pixels 5 --parsecs 10 --sigma 3
If all the files are in currrent directory, type the following command:
$ shao_run_batch_plot.sh
It will loop all the fits files in current directory and plot them, the default parameter is fixed for different BAND, so you can change the parameter using the command for single fits file.
Using slurm
If you want to use slurm to run the code, you can use the following command.
$ srun --comment=hetu_ai -N 1 -p insp-128C4T bash go.sh
The content of go.sh is same with the previous command.